Sunday, May 8, 2016

Implementing Content Security Policy. The Fortress of Cross Site Scripting #CSP #XSS

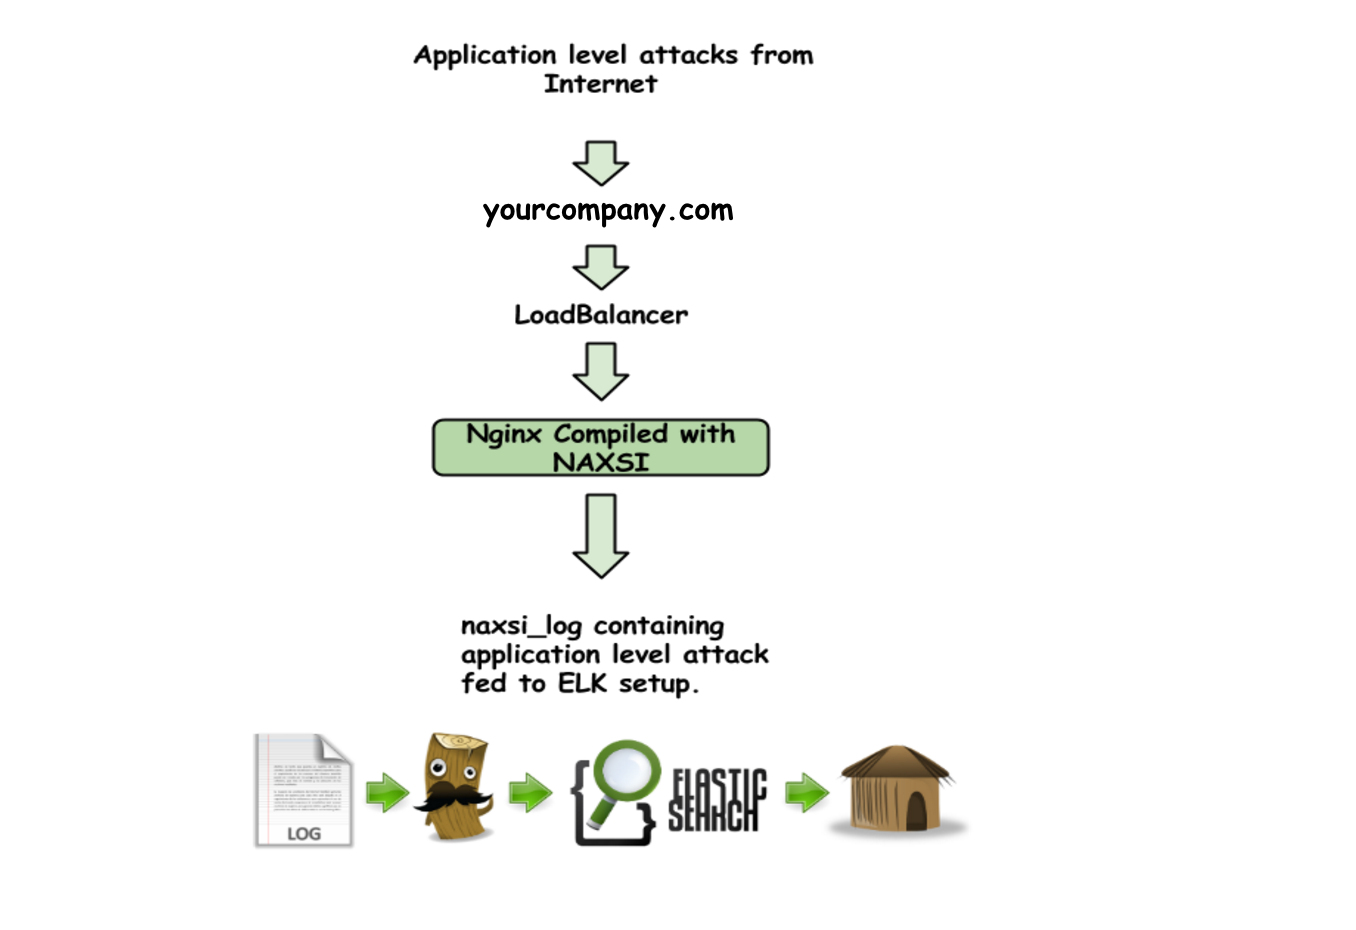
Content Security Policy is turning out to be one of the solutions at "scale" for fixing cross site scripting. In this blog I have tried condensing data from multiple sources from the internet to focus on the important things one need to know to implement CSP for the first time. The idea of this blog post is to help security engineers who want to figure out where to start on CSP if they are in the process of implementing one on their production environments.
Introducing Content Security Policy:
Content Security Policy (CSP) is an added layer of security that helps to detect and mitigate certain types of attacks, including Cross Site Scripting (XSS) and data injection attacks. These attacks are used for everything from data theft to site defacement or distribution of malware.

The web’s security model is rooted in the same origin policy, code from https://mybank.com should only have access to https://mybank.com’s data, and https://evil.example.com should certainly never be allowed access. Each origin is kept isolated from the rest of the web, giving developers a safe sandbox in which to build and play. In theory, this is perfectly brilliant. In practice, attackers have found clever ways to subvert the system

CSP is designed to be fully backward compatible; browsers that don't support it still work with servers that implement it, and vice-versa. Browsers that don't support CSP simply ignore it, functioning as usual, defaulting to the standard same-origin policy for web content. If the site doesn't offer the CSP header, browsers likewise use the standard same-origin policy
Here is the list of browsers that support CSP.

Pre-Requisites:
Before jumping on to the implementation part, It is recommended you go through the W3C CSP recommendations and also few other links I think can be helpful for easy implementation:

Pre-production Testing:
  • Before implementing CSP on the production server, I recommended to use CSP tester chrome plugin to test the effects and to identify correct directives to be used as per your need.
  • This plugin simulates the behaviour of an actual CSP header sent in the response.

Screen Shot 2015-10-05 at 4.19.10 pm.png

  • CSP tester plugin + Console Errors are the best way one can debug the error messages which occur by adding CSP header.

Screen Shot 2015-10-05 at 4.19.50 pm.png


Secure way of Implementing CSP:
  • There are multiple ways to implement CSP. Just by whitelisting javascript source files, one does not end up securing the application from XSS. Developers normally implement CSP in a way which makes their work easier leaving the application still vulnerable to XSS. 

CSP Directives:
Content-Security-Policy: default-src 'none’

The first step to start a CSP header is to specify which is the default source list. A better practise to implement this is to call it ‘none’, which will encourage us to whitelist all the sources we have.
Few sources to be considered [script,style,connect,object,img,child]

Content-Security-Policy: script-src 'self' https://img1a.flixcart.com; https://img1a.flixcart.com

Whitelist all the script origins as shown in above example and make sure we do not add ‘unsafe-inline’ to the script-src directive. If we allow inline javascript to run than it could defeat the purpose of CSP.
With unsafe-inline we allow inline JS to execute in our application, which means if the application is vulnerable to XSS, an attacker will still be able to execute JS in the context of our application.

Handling Inline JS:
If we have inline javascript which requires to execute then we need to specify a random nonce in the header. We have to generate this nonce at the server end and send it across in the CSP header and consume the same in our inline Javascripts.
To use a nonce, give your script tag a nonce attribute. Its value must match one in the list of trusted sources. 
Example:

Content-Security-Policy: script-src 'nonce-EDNnf03nceIOfn39fn3e9h3sdfa

<script nonce=EDNnf03nceIOfn39fn3e9h3sdfa>
 //Some inline code I cant remove yet, but need to asap.
</script>

Example Policy:

Content-Security-Policy:
default-src 'none'; script-src 'nonce-EDNnf03nceIOfn39fn3e9h3sdfa http://img1a.flixcart.com http://img2a.flixcart.com https://www.google-analytics.com https://s3.amazonaws.com;
style-src https://img1a.flixcart.com ‘unsafe-inline’ ‘unsafe-eval’; img-src https://img1a.flixcart.com;
connect-src https://api.mybank.com; child-src 'self'; font-src 'self' *
report-uri https://www.flipkart.com/appErrors

Here is the explanation of the above policy:

default-src - We default all origins as none, which forces us to specify all the source origins in all the ‘src’ directives.
script-src - We mention all the script sources we want to consume our JS files from, also all the analytics files and if any inline nonces.
style-src - All the CSS files needs to go in this directive.
img-src - All the image cdn sources need to be mentioned in this directive.
connect-src- All the Ajax(xhr) requests connections needs to be specified in this directive.
report-uri- This directive is important for debugging any violations which occur on production. A json blob is sent to the mentioned endpoint with appropriate error information.

For more clarity on CSP directives we suggest to follow this article.

Firefox recently came up with a feature that allows us to test the secure implementation of CSP on any website. Just by opening the developer console and typing in "security csp" one can see the entire report.

Attack Monitoring Using ELK #outofband #ELK #osquery #filebeat #ElasticSearch

Me and Himanshu took a one day Null Bachaav session yesterday on Attack monitoring. 
It was a good turnout with a mix of people with very little knowledge of SIEM to someone who has been full time working on SIEM products. We covered most of topics that we normally deliver in a 2 day workshop at NullCon. Sharing the presentation below. 


Tweet me @prajalkulkarni if you need help with any specific topics.

Some references:
CloudFares #outofband DDOS protection :https://www.youtube.com/watch?v=XiK4643YdOk

Saturday, April 16, 2016

A cheap and effective Web App Firewall with continuos real time attack monitoring. #nginx #mod_security #naxsi #ElasticSearch #Kibana

I wanted to share one of my projects I worked on last year. We were trying to solve for “how to alert real time Web attacks” on our infrastructure. After a lot of brainstorming sessions we discarded the idea of having enterprise WAF solutions which are sold by many big players in the market. Most of the enterprise solutions work “inline” with your internet traffic and that chokes up considerable amount of your bandwidth.Having said that, I do not discourage anyone exploring these solutions. 

So we started exploring multiple open source products which are under active development. We chose NAXSI and Mod Security as our prime targets and started our research in how we can extract the best out these two.

Since we were experimenting these on Nginx web server, we had to evaluate the one which gives us desirable output in terms of minimal performance impact and almost no false positives. We evaluated ModSecurity first and found it to be quite unstable, we observed multiple nginx worker processes dying on a regular intervals. However, these problems might have been solved with current commits to the project [https://github.com/SpiderLabs/ModSecurity/issues].
I found NAXSI to be more stable in terms of performance, but it requires a lot of tuning to cut down false/positives.

Stats:[This may vary depending upon what all modules nginx has been compiled]
Nginx -
65K qps
Max CPU Usage: 55%
Nginx+Naxsi
65K qps
Max CPU Usage: 68%

So, here on, I will be talking about how one can compile NAXSI with Nginx 1.4.4+ and fine tune it and have a continuous alert monitoring around the same.

What is NAXSI?:

NAXSI means Nginx Anti Xss & Sql Injection.Its a web application firewall (WAF) which comes as a nginx module which needs to be compiled from source, it is also available as a package for many UNIX-like platforms. This module, by default, reads a small subset of simple rules (naxsi_core.rules) containing 99% of known patterns involved in websites vulnerabilities. For example, '<', '|' or 'drop' are not supposed to be part of a URI.
Naxsi is different from other WAF solutions, since it totally relies on a whitelist approach and not a signature based approached which is a lot more slower and resource consuming.

So with Naxsi in place we were able to have decent picture of which all IP addresses were attacking us and how we can stop them at our edge network.


To start with let's look at a simple architecture of our Web application Firewall.


Screen Shot 2016-04-15 at 8.28.18 PM.png


Here are simple steps to compile NAXSI from source :
  1. Select the nginx tar file here(http://nginx.org/download/)
  2. Untar it in the /opt folder
  3. wget the newest naxsi source code (https://github.com/nbs-system/naxsi) in /opt folder
  4. install libpcre3-dev
  5. cd nginx-1.4.4 and start compiling
  6. sudo ./configure --pid-path=/var/run/nginx.pid --lock-path=/var/lock/nginx.lock --with-http_ssl_module --with-debug --http-log-path=/var/log/nginx/access.log --conf-path=/etc/nginx/fk_nginx.conf --with-http_stub_status_module --user=nginx --error-log-path=/var/log/nginx/error.log --prefix=/usr/local/nginx_new --sbin-path=/usr/sbin/nginx --with-http_realip_module --http-client-body-temp-path=/var/lib/nginx/body --http-proxy-temp-path=/var/lib/nginx/proxy --http-fastcgi-temp-path=/var/lib/nginx/fastcgi --http-proxy-temp-path=/var/lib/nginx/proxy --http-scgi-temp-path=/var/lib/nginx/scgi --http-uwsgi-temp-path=/var/lib/nginx/uwsgi --add-module=../naxsi/naxsi_src/
  7. sudo make && sudo make install
  8. Now copy the naxsi main ruleset file to /etc/nginx → sudo cp naxsi_core.rules /etc/nginx/naxsi_core.rules
  9. sudo nano /etc/nginx/nginx.conf
  10. [add the /etc/nginx/naxsi_core.rules in include directive] 
sudo nano/etc/nginx/nginx.conf
http {

       include /etc/nginx/naxsi_core.rules;

       }
11. Create the Whitelist file my_naxsi.rules
Few links for whitelist creation:
https://github.com/nbs-system/naxsi/wiki/whitelists
For a simple apt-get installation follow : https://www.digitalocean.com/community/tutorials/how-to-install-and-configure-naxsi-on-ubuntu-14-04

We used NAXSI in learning mode to avoid as much noise as possible. For creating the ruleset I recommend running it in production in Learning mode and gathering a significant amount of valid traffic, and post running the nxutil script to generate the whitelist that is specific to your prod environment.
More details on nxutils can be found here: https://github.com/prajal/nxutil
 
NAXSI write all its attack logs in nginx error location:
/var/log/nginx/error.log

Example Error logs:
2015/03/27 12:00:18 [error] 22909#0: *13840757 NAXSI_FMT: ip=ATTACKIP&server=www.yourcompany.com&uri=/&learning=1&vers=0.54&total_processed=22184&total_blocked=20&block=1&zone0=BODY&id0=16&var_name0=, client: ATTACKIP, server: www.youcompany.com, request: "POST /?t=12:00:17%20PM HTTP/1.1", host: "A.B.C.D"

2015/11/14 14:43:36 [error] 5182#0: *10 NAXSI_FMT: ip=X.X.X.X&server=Y.Y.Y.Y&uri=/some--file.html&learning=1&total_processed=10&total_blocked=6&zone0=URL&id0=1007&var_name0=&zone1=ARGS&id1=1007&var_name1=asd, client: X.X.X.X, server: localhost, request: "GET /some--file.html?asd=-- HTTP/1.1", host: "Y.Y.Y.Y"

Now that we have the log, we need to ingest it into our Log system. The most important part of this process is indexing the correct components we would want to visualise later in kibana. For us the crucial part was the clientIP “ip” and the “request” part of the log.


Screen Shot 2016-04-16 at 11.59.29 AM.png

Now once your Kibana dashboard is up and ready I recommend using Elastalerts  
[https://github.com/Yelp/elastalert] to get the necessary alerting for the attack IP’s that you are monitoring for.

Here is a quick attack alert triggered:


Some References:
If you are planning to implement NAXSI in your infrastructure I recommend reading 


Sunday, July 27, 2014

Installing ElasticSearch Logstash & Kibana #EKL #Logstash-forwader #COMBINEDAPACHELOG #AmazonEC2

It’s been a year since I last updated the blog, laziness wins any day! :P. This blog entry will illustrate how to setup an out of the box installation for EKL.This setup was done on Amazon EC2 instances, this will cover the following topics:

     a) Setting up ElasticSearch 
     b) Setting up Logstash Server
     c) Setting up Logstash-Forwader
     d) Setting up Kibana
        [Logstash 1.4.2 and Kibana 3 ElasticSearch 1.3]

Below is the pictorial setup which I have up and running.The Final aim would be to send Apache access logs from Server [EC2_A] to Server [EC2_B] and create a Elastic cluster named (elasticsearch) and show the graphical representation in Kibana


Here the EC2_A Server is our Logstash_forwader/Shipper. On our EC2_B we have the Elastic cluster and the logstash Server which is running, and the UI is shown in Kibana.

There are many online resources, which we can refer to get the above setup. However, they are not at one single place, I had to search at multiple places to get the above setup running.
One of the best resource I came across is the Logstash Cook Book  and the EKL installation guide by Digital Ocean.
Certainly, there were lot of initial breakers I faced, but with this blog entry I suppose one should not face any problems while installing.

For starters, who are not familiar with EKL can read about these components here. ElasticSearch(http://en.wikipedia.org/wiki/Elasticsearch), Logstash(http://logstash.net/), Kibana(http://rashidkpc.github.io/Kibana/).

Let’s Start!

We will try setting up the EC2_B box first.

EC2_B Config: (Micro instance) Ubuntu Server 14.04_32bit: Linux ip-192.168.2.2 3.13.0-29-generic #53-Ubuntu SMP Wed Jun 4 21:02:19 UTC 2014 i686 i686 i686 GNU/Linux

Installing Dependencies:

(The only prerequisite required by Logstash is Java runtime)

$ sudo add-apt-repository -y ppa:webupd8team/java
$ sudo apt-get update
$ sudo apt-get -y install oracle-java7-installer
Now try:
$ java -version
java version "1.7.0_45"
Java(TM) SE Runtime Environment (build 1.7.0_45-b18)
Java HotSpot(TM) 64-Bit Server VM (build 24.45-b08, mixed mode)

Install Elastic Search:
$ tar zxvf elasticsearch-1.1.1.tar.gz
$ cd elasticsearch-1.1.1/
$ ./bin/elasticsearch &    --This will start Elastic Search

Install Kibana:
$ tar xvf kibana-3.0.1.tar.gz
$ sudo vi ~/kibana-3.0.1/config.js --Now change the text from 9200 to 80
  elasticsearch: "http://"+window.location.hostname+":80”,
$ sudo mkdir -p /var/www/kibana3
$ sudo cp -R ~/kibana-3.0.1/* /var/www/kibana3/

Install nginx to host Kibana:
$ sudo apt-get install nginx
$ vi nginx.conf   --Now change the value of root as below
  root to /var/www/kibana3;
$ sudo service nginx restart
Now go to http://[IP]/kibana3 to check if Kibana UI is visible.


Install Logstash:
$ tar zxvf logstash-1.4.2.tar.gz

Now Generate the SSL Certificate:
$ sudo mkdir -p /etc/pki/tls/certs
$ sudo mkdir /etc/pki/tls/private

Now we will edit the openssl.cnf file so that later on we won’t face any issues when we compile our logstash-forwader using go1.3 linux/amd64 on EC2_A (More details here)

$ Vi /etc/ssl/openssl.cnf
In the [v3_ca] section add the following entry
subjectAltName = IP:192.168.2.2

Note: Here the IP address has to be of the EC2_B. machine.

Now lets create a index on our Elastic cluster:

Lets first install a plugin named "head"

$ cd ~/elasticsearch-1.1.1/
$ bin/plugin --install mobz/elasticsearch-head

Now go to http://IP(EC2_B):9200/_plugin/head/

Go to indices tab and create a new index called "apache"


Now Generate the Self signed certs:
$ cd /etc/pki/tls; sudo openssl req -x509 -batch -nodes -newkey rsa:2048 -keyout private/logstash-forwarder.key -out certs/logstash-forwarder.crt
The same certificate "logstash-forwarder.crt” has to be imported to logstash_forwader server (EC2_A). Please do this using appropriate “scp” commands.

Configure Logstash:
$ nano ~/logstash-1.4.2/logstash.conf


input {
  lumberjack {
    port => 5000
    type => "apache-access"
    ssl_certificate => "/etc/pki/tls/certs/logstash- forwarder.crt"
    ssl_key => "/etc/pki/tls/private/logstash-forwarder.key" 
}
}
filter {
  grok {
    type => "apache-access"
    pattern => "%{COMBINEDAPACHELOG}"
  }
}
output { 
  elasticsearch {
 host => localhost
 protocol => http
 index => “apache"
 cluster => "elasticsearch"
 index_type => "apache"

     } }

This creates a configuration file which will make the log stash listen on port 5000 (lumberjack) and accept incoming logs from the logstash forwarder. Also, the grok filter here I have specified as %{COMBINEDAPACHELOG} since we will be sending the apache access logs from the EC2_A server.

Now setting up our EC2_A server (Logstash_Forwader/Shipper):

EC2_A: (Micro instance) Ubuntu Server 14.04_64bit: Linux ip-192.168.2.1 3.13.0-29-generic #53-Ubuntu SMP Wed Jun 4 21:00:20 UTC 2014 x86_64 x86_64 x86_64 GNU/Linux

Make sure your Apace Server in running on this machine and java is also installed, or please refer to the first step.This machine will be used as a shipper to send apache logs to EC2_B.

$ unzip logstash-forwarder-master.zip
cd logstash-forwarder-master

Installing the developer tools:
sudo apt-get install build-essential

Installing Go:
sudo apt-get install python-software-properties
$ sudo apt-add-repository ppa:duh/golang
$ sudo apt-get update
$ sudo apt-get install golang
sudo apt-get install ruby rubygems ruby-dev
sudo gem install fpm

Creating the forwarder deb package.
umask 022
$ make deb
You'll see a long sequence of compilation and then some final execution as the fpm command runs and creates the DEB package.
Listing 1.34: Forwarder make output


Installing the forwarder:
$ sudo dpkg -i logstash-forwarder_0.2.0_i386.deb

Now create a folder to place the "logstash-forwarder.crt" certificate. Before that we need to import the "logstash-forwarder.crt" cert file that we created on the EC2_B server. Please do it via necessary scp commands.

$ mkdir /etc/certs

Place the "logstash-forwarder.crt" file in the /certs folder.Also, create the logstash-conf file:

$ nano /etc/logstash-forwarder/logstash-forwarder.conf

change Below IP to the IP of your Logstash Server

{
"network":
 {
"servers": [ “IP[EC2_B]:5000" ],
"ssl ca": "/etc/certs/logstash-forwarder.crt",
"timeout": 15
 },
"files": [
    {
"paths": ["/var/log/apache2/access.log"],
"fields": { "type": "apache-access" }
     }
        ]

}

Now Start the forwarder:
$ cd /opt/logstash-forwarder
$ bin/logstash-forwarder -config="/etc/logstash-forwarder/logstash-forwarder.conf" &

Finally Starting the Logstash Server on (EC2_B):
$ cd ~/logstash-1.4.2/
$ bin/logstash -f logstash.conf & --This will start the logstash server 


Any further changes to the access logs will be now visible in your kibana dashboard. To check the above setup, hit the default apache page @ (http://IP[EC2_A]/) and check the changes recorded by your elastic cluster on the kibana dashboard.


The dashboard I use is my personal favourite, which can be found here.
I hope this blog entry will be useful for a successful EKL installation. Do write a comment below if you get stuck anywhere.